在表单或者门户页面中展示图表
在需要展现图表的容器的queryLoad事件中加入
```
//echatsJS 资源路劲
var echartUrl = "../o2_lib/echarts/echarts.min.js";
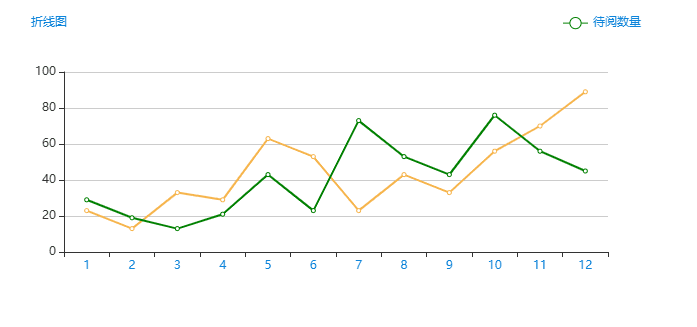
var data1 = ["23","13","33","29","63","53","23","43","33","56","70","89"];
var data2 = ["29","19","13","21","43","23","73","53","43","76","56","45"];
//使用o2.load方法引入资源
o2.load(echartUrl,function(){
//资源引入后回调方法
var bar = echarts.init(this.target.node);
var options = {
title: {
text: '折线图',
textStyle:{
color:"#078CEB",
fontSize:"16px"
},
left:"30"
},
color:['#F6B44C','green'],
legend: {
data: ['待办数量', '待阅数量'],
right:"30",
textStyle:{
color:"#087DD3"
}
},
xAxis: {
type: 'category',
axisLabel:{color:'#087DD3'},
//boundaryGap: false,
axisTick:{
show:true
},
data: [1,2,3,4,5,6,7,8,9,10,11,12]
},
yAxis: {
type: 'value'
},
series: [
{
name: '待办数量',
type: 'line',
//stack: '总量',
data: data1,
lineStyle:{
color:"#F6B44C",
width:2
}
},
{
name: '待阅数量',
type: 'line',
//stack: '总量',
data: data2,
lineStyle:{
color:"green",
width:2
}
}]
}
bar.setOption(options);
}.bind(this));
```
效果

评论